You signed in with another tab or window. Reload to refresh your session.You signed out in another tab or window. Reload to refresh your session.You switched accounts on another tab or window. Reload to refresh your session.Dismiss alert
This file contains hidden or bidirectional Unicode text that may be interpreted or compiled differently than what appears below. To review, open the file in an editor that reveals hidden Unicode characters.
Learn more about bidirectional Unicode characters
Prevent incorrect "barebone" method classification when methods use local slots beyond argument slots or modify locals via IINC which wasn't accounted for.
Avoid silently allowing opcodes that can implicitly throw (divide/remainder) in methods considered barebone.
Ensure volatile field code generation uses explicit atomic initialization and explicit acquire/release memory ordering to avoid undefined ordering and initialization issues.
Description
Added getVar() to IInc so the local index used by IINC is visible to analysis (vm/.../bytecodes/IInc.java).
Tightened BytecodeMethod.checkBarebone() to scan instructions for maximum local index used by VarOp and IInc and reject barebone if that index is >= argument slots (vm/.../BytecodeMethod.java).
Removed implicit divide/remainder opcodes from the allowed barebone instruction set to avoid methods that could throw implicitly from being marked barebone (vm/.../BytecodeMethod.java).
Modified volatile field codegen to use ATOMIC_VAR_INIT(0) for static volatile initialization and to call atomic_load_explicit(..., memory_order_acquire) / atomic_store_explicit(..., memory_order_release) for static and instance volatile accesses, including GC mark paths and static field marking (vm/.../ByteCodeClass.java).
Testing
No automated tests were executed as part of this change.
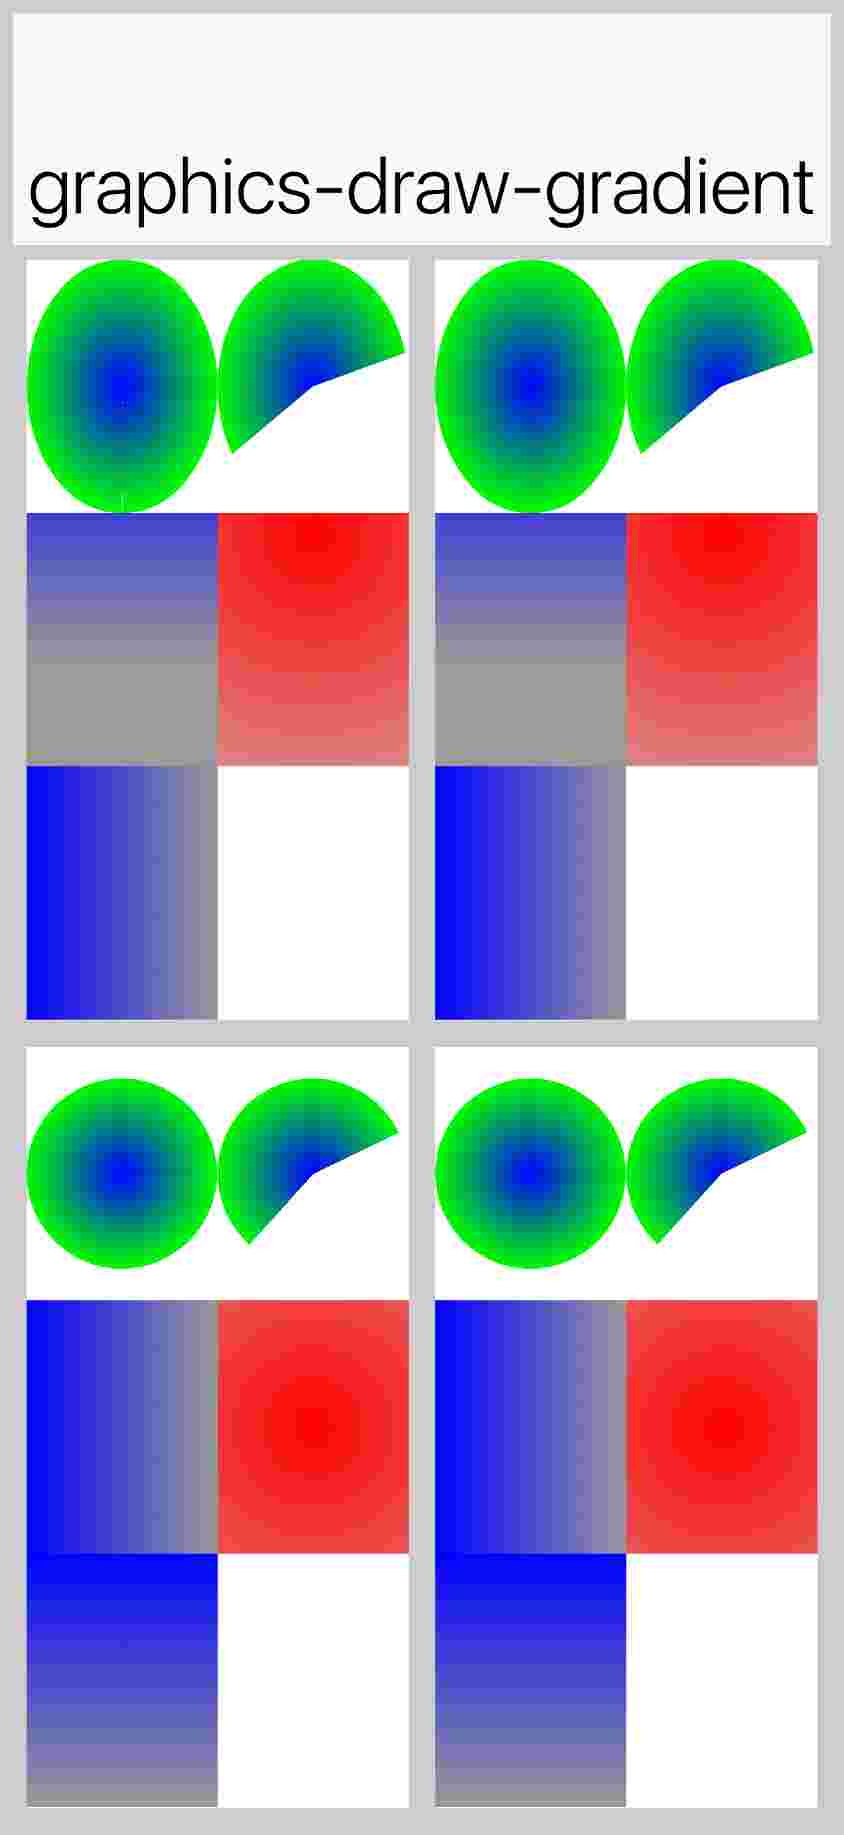
Preview info: JPEG preview quality 10; JPEG preview quality 10; downscaled to 844x1835. Full-resolution PNG saved as graphics-draw-gradient.png in workflow artifacts.
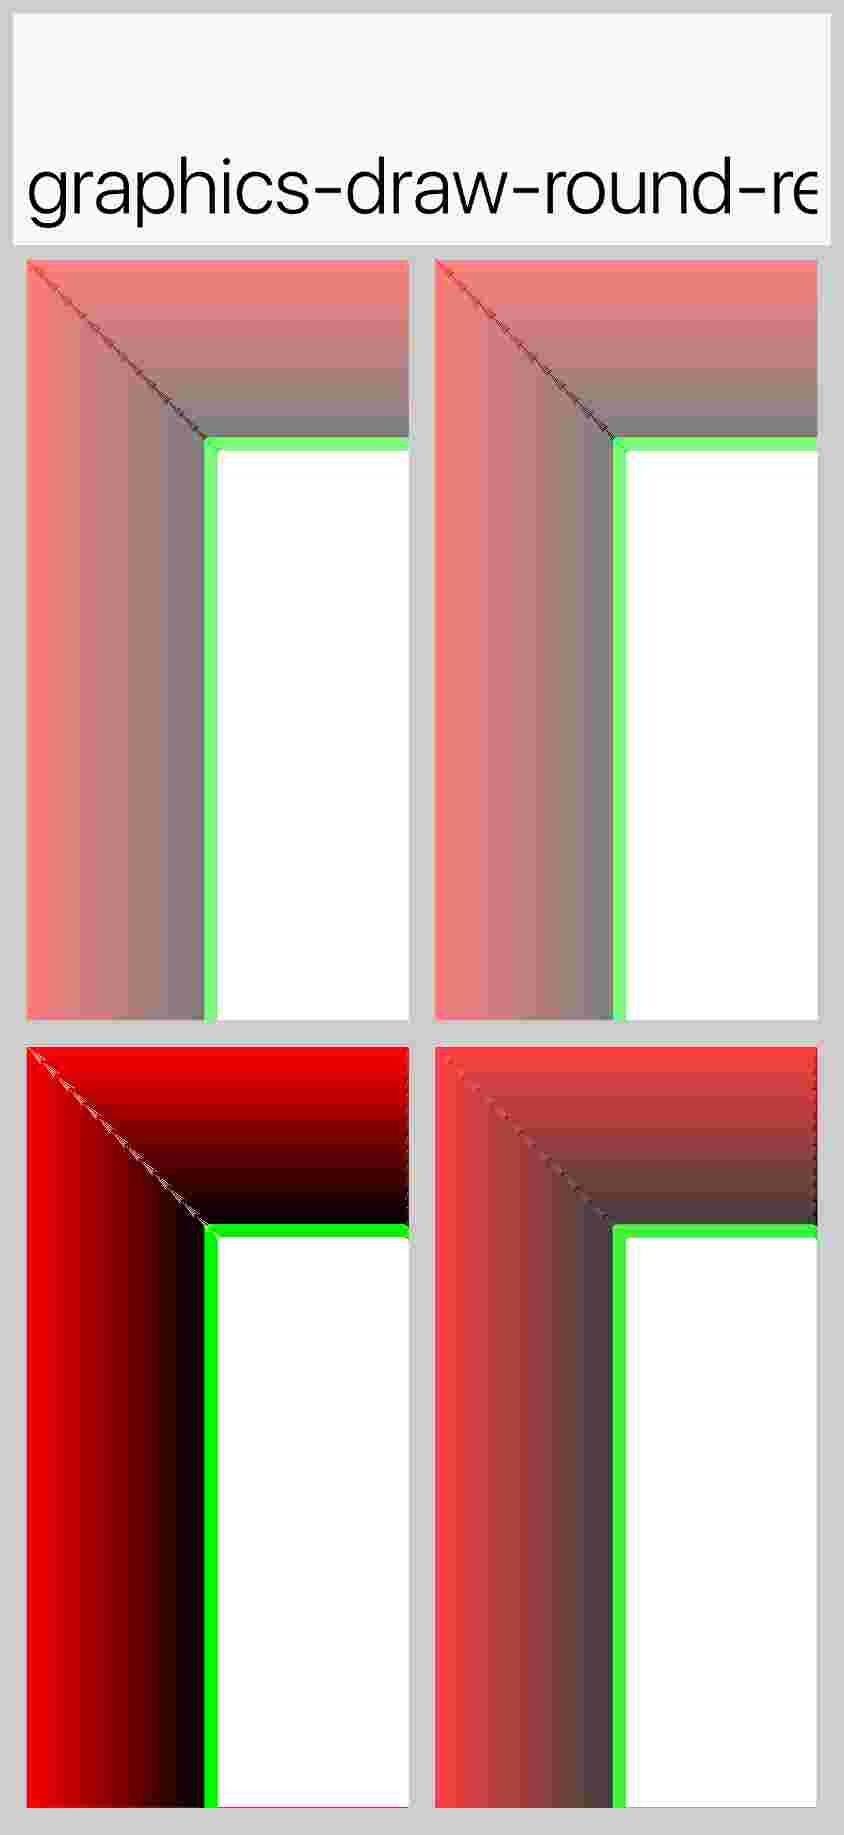
graphics-draw-round-rect — missing reference. Reference screenshot missing at /Users/runner/work/CodenameOne/CodenameOne/scripts/ios/screenshots/graphics-draw-round-rect.png.
Preview info: JPEG preview quality 10; JPEG preview quality 10; downscaled to 844x1835. Full-resolution PNG saved as graphics-draw-round-rect.png in workflow artifacts.
Add this suggestion to a batch that can be applied as a single commit.This suggestion is invalid because no changes were made to the code.Suggestions cannot be applied while the pull request is closed.Suggestions cannot be applied while viewing a subset of changes.Only one suggestion per line can be applied in a batch.Add this suggestion to a batch that can be applied as a single commit.Applying suggestions on deleted lines is not supported.You must change the existing code in this line in order to create a valid suggestion.Outdated suggestions cannot be applied.This suggestion has been applied or marked resolved.Suggestions cannot be applied from pending reviews.Suggestions cannot be applied on multi-line comments.Suggestions cannot be applied while the pull request is queued to merge.Suggestion cannot be applied right now. Please check back later.
Motivation
IINCwhich wasn't accounted for.barebone.Description
getVar()toIIncso the local index used byIINCis visible to analysis (vm/.../bytecodes/IInc.java).BytecodeMethod.checkBarebone()to scaninstructionsfor maximum local index used byVarOpandIIncand rejectbareboneif that index is >= argument slots (vm/.../BytecodeMethod.java).bareboneinstruction set to avoid methods that could throw implicitly from being markedbarebone(vm/.../BytecodeMethod.java).ATOMIC_VAR_INIT(0)for static volatile initialization and to callatomic_load_explicit(..., memory_order_acquire)/atomic_store_explicit(..., memory_order_release)for static and instance volatile accesses, including GC mark paths and static field marking (vm/.../ByteCodeClass.java).Testing
Codex Task